PRINT team members present a Digital Toolbox Talk on “Learning about Leaflet to Make Mobile Friendly Maps” at UCF’s Center for Humanities and Digital Research in November 2019.
PRINT team members present a Digital Toolbox Talk on “Learning about Leaflet to Make Mobile Friendly Maps” at UCF’s Center for Humanities and Digital Research in November 2019.
Conversation August 2019 between Bruce Janz, Director of UCF’s Center for Humanities and Digital Research, and Rosalind Beiler about the evolution of PRINT.
 The first step in designing and planning PRINT will be to create transcriptions with a data set derived from the Pemberton Papers, Quaker manuscript letters housed at the Historical Society of Pennsylvania. Our goal is to find an open-source transcription tool that will be user friendly. Two examples of similar manuscript-based transcription projects are the Shelley-Godwin Archive and Digital Paxton, both of which use a side-by-side interface with several embedded functionalities. The connectivity, accessibility, and other user features of this model are appealing. Digital Paxton uses From the Page, a proprietary tool, for managing transcriptions. Since we aim to use open-source software to foster academic collaboration, we will model PRINT’s interface on From the Page. Another way PRINT will encourage collaboration is by implementing the International Image Interoperability Framework (IIIF) – a system that connects documents to other collections using the framework. IIIF also supports interaction with features that allow users to view, manipulate, and annotate the images.
PRINT’s transcription interface, like From the Page, will present a digital facsimile of the original letter alongside the transcription. Seeing line-by-line comparisons allows users to become familiar with and capable of identifying characters. The transcribed text window also will support hyperlinking, which will create relationships among the documents in the collection. PRINT plans to implement hyperlinked subject tagging, a function that will allow users to query the database for subjects, such as people, places, or themes found in transcribed texts. Clicking on these subject links in the text brings users to a page containing all references of the subject throughout the collection, enhancing user interactions with the documents. Additionally, these tags can be used to construct visualizations of the connections between the subject and others in the database, supplementing PRINT’s other forms of network visualization. With Leaflet’s ability to read a database and generate elements into a responsive visualization, text markup and encoding is an essential element to the transcription project.
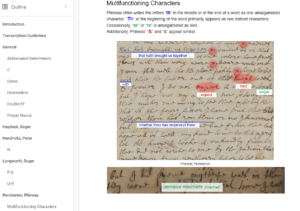
In addition to comprising a data set for visualization and contributing to the historical record of network analysis, the correspondence collected for PRINT provides excellent educational opportunities for engagement with and instruction in seventeenth- and eighteenth-century paleography. A few educational and supplemental materials are available at the transcription project’s outset: a style guide, biographic information of correspondents, and a manual outlining both the general paleography of the period and the idiosyncrasies of correspondents’ hands (see figure on the right). As project funding increases, existing materials will be expanded and more will be produced. Future materials will include videos, a physical and/or digital handwriting exercise, and other methods not yet developed. PRINT aims to provide engaging and effective materials encompassing a variety of learning styles, thus increasing access to the database and its materials.

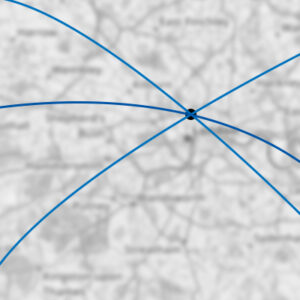
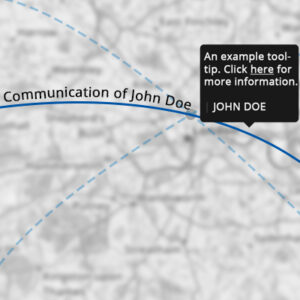
By using the Leaflet JavaScript library to plot and track correspondence networks in the PRINT project we are able to provide more detail as users refine their selection through the website display options. The ability to zoom in to provide more information is important since our target historical correspondence networks frequently share the same nodes, i.e. cities, which can create a data clustering issue when trying to present the data visually. By creating multiple view levels, the PRINT Leaflet instance will be able to demonstrate spatial themes at the macro level zoom while at the same time providing details on specific nodes, correspondence routes, and people at the micro level zoom. The images provided here show a low fidelity mockup of how the map layers will handle different map layers. The map shown in the background has been blurred so as to enhance the demonstration, no view levels on the production environment will ever have a blurred map.

The first image on the right shows what could be considered a typical array of lines that overlap over a single node. If you were to try and include text or any additional information, the Leaflet map would be hard to view and contextualize. While our example here shows just three correspondence paths, as the PRINT project adds more data the macro level views will have be condensed and consolidated. This will force users to zoom to discern individual correspondence paths. In the second image on the right you can see an individual path of correspondence that has been selected. All other correspondence paths have changed style and opacity so as to bring the selected path into visual focus. With this style of view a tool tip and writing on the path can be viewed with easy, allowing more visual real estate for content and links to accompanying documentation.